Analyze Conformations
First, necessary imports:
In [1]: from prody import *

In [2]: from numpy import *

In [3]: from pylab import *

In [4]: ion()

In [5]: import os, glob
Parse conformations
Now, let’s read initial and refined conformations:
In [6]: initial = AtomGroup('p38 initial')

In [7]: refined = AtomGroup('p38 refined')
In [8]: for pdb in glob.glob('p38_ensemble/*pdb'):
   ...:     fn = os.path.splitext(os.path.split(pdb)[1])[0]
   ...:     opt = os.path.join('p38_optimize', fn + '.coor')
   ...:     parsePDB(pdb, ag=initial)
   ...:     parsePDB(opt, ag=refined)
   ...:
In [9]: initial
Out[9]: <AtomGroup: p38 initial (5658 atoms; active #0 of 40 coordsets)>

In [10]: refined
Out[10]: <AtomGroup: p38 refined (5658 atoms; active #0 of 40 coordsets)>
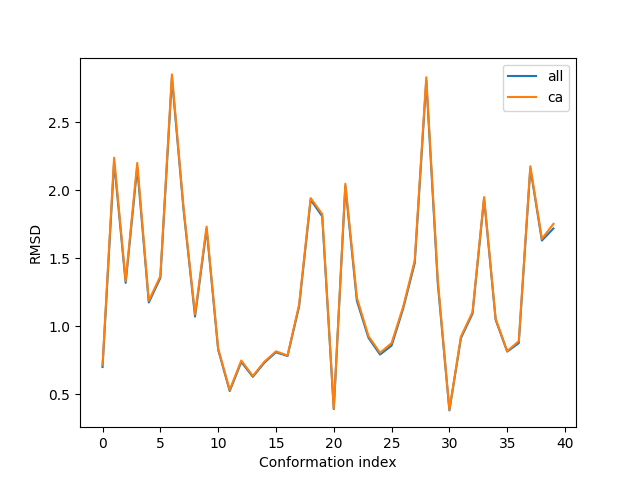
Calculate RMSD change
We can plot RMSD change after refinement as follows:
In [11]: rmsd_ca = []

In [12]: rmsd_all = []

In [13]: initial_ca = initial.ca

In [14]: refined_ca = refined.ca

In [15]: for i in range(initial.numCoordsets()):
   ....:     initial.setACSIndex(i)
   ....:     refined.setACSIndex(i)
   ....:     initial_ca.setACSIndex(i)
   ....:     refined_ca.setACSIndex(i)
   ....:     rmsd_ca.append(calcRMSD(initial_ca, refined_ca))
   ....:     rmsd_all.append(calcRMSD(initial, refined))
   ....:

In [16]: plot(rmsd_all, label='all');

In [17]: plot(rmsd_ca, label='ca');

In [18]: xlabel('Conformation index');

In [19]: ylabel('RMSD');

In [20]: legend();
Select a diverse set
To select a diverse set of refined conformations, let’s calculate average RMSD for each conformation to all others:
In [21]: rmsd_mean = []

In [22]: for i in range(refined.numCoordsets()):
   ....:     refined.setACSIndex(i)
   ....:     alignCoordsets(refined)
   ....:     rmsd = calcRMSD(refined)
   ....:     rmsd_mean.append(rmsd.sum() / (len(rmsd) - 1))
   ....:

In [23]: bar(arange(1, len(rmsd_mean) + 1), rmsd_mean);

In [24]: xlabel('Conformation index');

In [25]: ylabel('Mean RMSD');
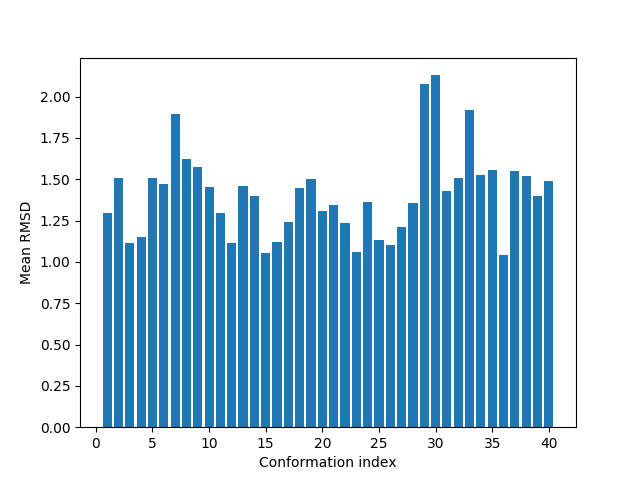
Let’s select conformations that are 1.2 Å away from other on average:
In [26]: selected = (array(rmsd_mean) >= 1.2).nonzero()[0]

In [27]: selected
Out[27]:
array([ 0,  1,  4,  5,  6,  7,  8,  9, 10, 12, 13, 16, 17, 18, 19, 20, 21,
       23, 26, 27, 28, 29, 30, 31, 32, 33, 34, 36, 37, 38, 39])

In [28]: selection = refined[selected]

In [29]: selection
Out[29]: <Selection: 'index 0 to 1 4 ... to 34 36 to 39' from p38 refined (31 atoms; active #39 of 40 coordsets)>
