Visualization & Analysis
Following interface can be used to generate a quick visualization of results from druggability analysis.
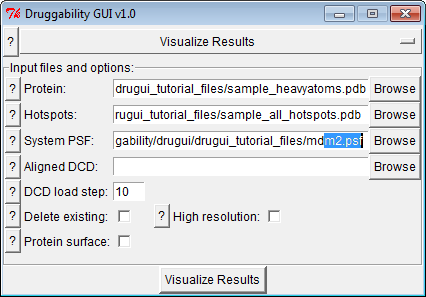
Input Files
Input files are prefix_heavyatoms.pdb and other PDB files
in prefix folder.
Options & Parameters
- If you have outputted aligned trajectory in grid calculation step, you can select to load it too.
- Optionally, molecules present in VMD can be deleted, high resolution representations and a protein surface representation can be generated.
Probe binding spots
When results are loaded, you will see a representation similar to the following:
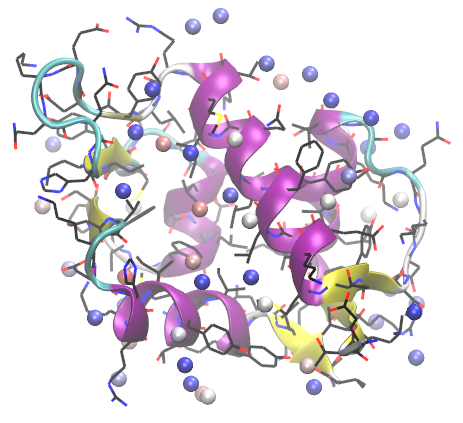
Each sphere corresponds to a probe binding spot. Spheres are colored according to their binding free energies. Red most sphere has the lowers binding free energy.
Binding free energies of probes can be found in the logfile:
defaults is initialized.
defaults working directory is set to "defaults".
Druggability Analysis defaults is initialized.
Parameter: temperature 300.00 K
Parameter: delta_g -1.000 kcal/mol
Parameter: n_probes 7
Parameter: min_n_probes 6
Parameter: merge_radius 5.5 A
Parameter: low_affinity 10.00 uM
Parameter: n_solutions 3
Parameter: max_charge 2.0 e
Parameter: n_charged 3
Parameter: n_frames 1
Parsing OpenDX file defaults_IPRO.dx.
defaults_IPRO was parsed in 0.45s
Parsing OpenDX file defaults_IPAM.dx.
defaults_IPAM was parsed in 0.45s
Parsing OpenDX file defaults_ACAM.dx.
defaults_ACAM was parsed in 0.45s
Parsing OpenDX file defaults_ACET.dx.
defaults_ACET was parsed in 0.45s
Searching probe binding hotspots with deltaG less than -1.00 kcal/mol (~5 folds enrichment).
51 all-probes binding spots were identified in 1.07s.
Minimum binding free energy is -2.73 kcal/mol.
Hotspot   1 -2.73 kcal/mol 100.0% IPRO
Hotspot   2 -2.36 kcal/mol 100.0% IPRO
Hotspot   3 -2.34 kcal/mol  95.3% ACET   2.5% IPRO   2.2% ACAM
Hotspot   4 -2.33 kcal/mol 100.0% IPRO
Hotspot   5 -2.28 kcal/mol  93.4% IPRO   3.8% ACAM   2.8% IPAM
Hotspot   6 -2.23 kcal/mol  98.8% IPRO   1.2% ACAM
Hotspot   7 -2.19 kcal/mol  94.6% IPRO   2.9% ACAM   2.5% ACET
Hotspot   8 -2.13 kcal/mol  99.5% IPRO   0.3% ACET   0.2% ACAM
Hotspot   9 -2.13 kcal/mol  96.9% IPRO   3.1% ACAM
Hotspot  10 -2.02 kcal/mol  84.5% IPRO  15.5% ACAM
Hotspot  11 -2.00 kcal/mol  83.9% IPAM  12.7% IPRO   3.4% ACAM
Hotspot  12 -1.98 kcal/mol  93.2% IPRO   4.7% ACAM   2.1% IPAM
Hotspot  13 -1.91 kcal/mol  97.2% IPRO   2.8% ACAM
Hotspot  14 -1.89 kcal/mol  80.7% IPRO  18.0% ACET   1.3% ACAM
Hotspot  15 -1.85 kcal/mol  94.5% IPRO   4.7% IPAM   0.7% ACET   0.2% ACAM
Hotspot  16 -1.79 kcal/mol  82.5% IPRO  10.2% ACAM   5.6% ACET   1.6% IPAM
Hotspot  17 -1.75 kcal/mol  97.6% IPRO   2.4% ACAM
Hotspot  18 -1.72 kcal/mol  98.9% IPRO   0.6% ACAM   0.5% IPAM
Hotspot  19 -1.70 kcal/mol  46.3% ACET  45.4% IPRO   5.4% ACAM   2.9% IPAM
Hotspot  20 -1.56 kcal/mol  63.6% IPRO  22.7% ACET  11.7% ACAM   2.0% IPAM
Hotspot  21 -1.53 kcal/mol  79.7% ACET  20.3% IPRO
Hotspot  22 -1.44 kcal/mol  95.7% IPRO   4.3% ACAM
Hotspot  23 -1.40 kcal/mol  87.4% IPRO  11.0% IPAM   1.6% ACAM
Hotspot  24 -1.36 kcal/mol  50.2% ACET  49.8% IPRO
Hotspot  25 -1.30 kcal/mol  80.4% ACET  18.9% IPRO   0.7% ACAM
Hotspot  26 -1.30 kcal/mol  72.1% IPRO  16.0% ACET   6.6% IPAM   5.4% ACAM
Hotspot  27 -1.27 kcal/mol  54.5% IPRO  24.3% ACET  21.3% ACAM
Hotspot  28 -1.26 kcal/mol  88.4% ACET   9.0% IPRO   2.5% ACAM
Hotspot  29 -1.26 kcal/mol  78.4% ACET  18.6% IPRO   3.0% ACAM
Hotspot  30 -1.25 kcal/mol  89.8% IPRO   8.7% ACAM   1.5% IPAM
Hotspot  31 -1.24 kcal/mol  97.7% IPRO   2.3% ACAM
Hotspot  32 -1.23 kcal/mol  83.9% IPRO  16.1% ACAM
Hotspot  33 -1.23 kcal/mol  85.7% IPAM  13.5% IPRO   0.8% ACAM
Hotspot  34 -1.21 kcal/mol  94.0% IPRO   5.8% ACAM   0.3% IPAM
Hotspot  35 -1.20 kcal/mol  90.2% IPRO   6.4% IPAM   3.4% ACAM
Hotspot  36 -1.15 kcal/mol  90.3% IPRO   8.8% ACAM   0.9% ACET
Hotspot  37 -1.14 kcal/mol  88.9% IPRO  10.2% ACET   0.9% ACAM
Hotspot  38 -1.13 kcal/mol  94.7% IPRO   5.3% ACAM
Hotspot  39 -1.11 kcal/mol  99.0% ACET   0.6% IPRO   0.3% ACAM
Hotspot  40 -1.10 kcal/mol  97.4% IPRO   2.3% ACAM   0.3% IPAM
Hotspot  41 -1.09 kcal/mol  85.9% IPRO   8.7% ACAM   5.0% IPAM   0.3% ACET
Hotspot  42 -1.08 kcal/mol 100.0% IPRO
Hotspot  43 -1.08 kcal/mol 100.0% IPRO
Hotspot  44 -1.08 kcal/mol  96.6% IPRO   3.4% ACAM
Hotspot  45 -1.08 kcal/mol  55.8% IPAM  33.6% IPRO  10.6% ACAM
Hotspot  46 -1.06 kcal/mol  97.9% IPRO   2.1% ACAM
Hotspot  47 -1.06 kcal/mol  86.0% ACET  11.6% IPRO   2.1% ACAM   0.4% IPAM
Hotspot  48 -1.05 kcal/mol  96.8% IPRO   3.2% ACAM
Hotspot  49 -1.03 kcal/mol 100.0% IPRO
Hotspot  50 -1.01 kcal/mol  86.7% IPRO  11.8% IPAM   1.5% ACAM
Hotspot  51 -1.01 kcal/mol  85.6% IPRO   8.4% ACET   6.1% ACAM
IPRO: 39 isopropanol binding hotspots were identified.
IPRO: lowest binding free energy is -2.73 kcal/mol.
IPAM: 3 isopropylamine binding hotspots were identified.
IPAM: lowest binding free energy is -2.00 kcal/mol.
ACAM: 0 acetamide binding hotspots were identified.
ACET: 9 acetate binding hotspots were identified.
ACET: lowest binding free energy is -2.34 kcal/mol.
Clustering probe binding hotspots.
Clustering completed in 2.64ms.
1 potential sites are identified.
Calculating achievable affinity ranges.
Site 1: 16 probe binding hotspots
Site 1: Lowest probe binding free energy -2.36 kcal/mol
Site 1: Average probe binding free energy-1.56 kcal/mol
Site 1: Total of 70 solutions.

Achievable affinities for site 1
-log10(affinity)
     #-------------#
9.53 |o            |
9.28 |-o           |
9.03 |--------o    |
8.79 |----------o  |
8.54 |-----------o |
8.29 |---------o   |
8.05 |--------o    |
7.80 |-----o       |
7.56 |----o        |
7.31 |----o        |
     #-------------#
     0    5   10
Site 1: Lowest drug-like binding free energy -13.07 kcal/mol
Site 1: Highest drug-like affinity 0.298 nM
Site 1: Solution 1 binding free energy -13.07 kcal/mol
Site 1: Solution 1 affinity 0.298 nM
Site 1: Solution 1 total charge 0.02 e
Site 1: Solution 1 number of hotspots 7
Site 1: Solution 1 approximate volume 450.58 A^3
Site 1: Solution 2 binding free energy -12.66 kcal/mol
Site 1: Solution 2 affinity 0.593 nM
Site 1: Solution 2 total charge -0.03 e
Site 1: Solution 2 number of hotspots 7
Site 1: Solution 2 approximate volume 449.28 A^3
Site 1: Solution 3 binding free energy -12.49 kcal/mol
Site 1: Solution 3 affinity 0.780 nM
Site 1: Solution 3 total charge 0.03 e
Site 1: Solution 3 number of hotspots 7
Site 1: Solution 3 approximate volume 451.70 A^3
Hotspots are written into file defaults/defaults_all_hotspots.pdb.
defaults is cPickled into file defaults/defaults.dso.gz.
Logfile lists all probe binding spots, their binding free energies, and fractional contribution of different probe types to the hotspot.
Druggable Sites
Druggable sites are identified by clustering probe binding spots and merging them to identify subsets of binding spots that have a size similar to that of a drug-like molecule. After results load, you will see a list of molecules in VMD Main for each druggable site and solutions therein. You can toggle displayed molecules to see locations of different sites and solutions.
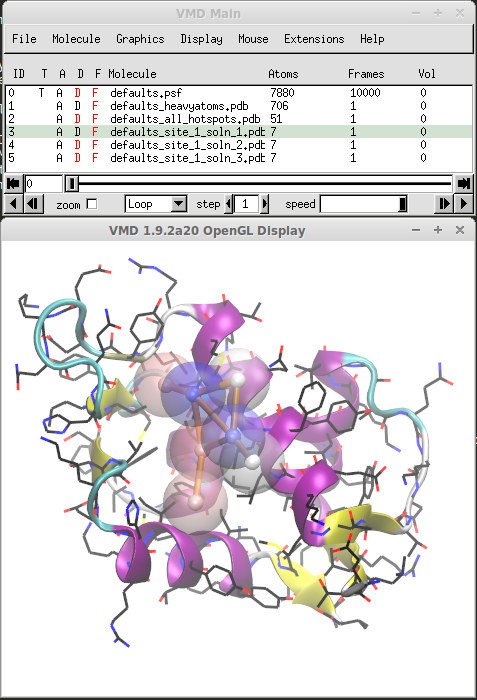
Figure shows the best solution for protein MDM2. The maximal achievable affinity (druggability index) for this solution is 0.3 nM or, in terms of free energy, it is -13 kcal/mol. You can find such information in the log file shown above.
Probe binding hotspots and protein structure shown above can be found among tutorial files. These results of course deserve a more detailed analysis, and some things that can be done include:
- looking into types of probes that contribute to a given binding spot and types of amino acid residue interacting with the binding spot
- visualizing trajectories (in which probes are wrapped) to see specific interactions and residence time of probes at a given binding spot
- comparing results from simulations in presence and absence of probes to see how binding site shape is affected by ligand binding
- looking into other structures of the target protein (ligand binding sites, crystal contacts, protein interfaces) to see whether observations in simulations are supported by interactions determined experimentally
Visualize Probe Grids
Finally, you can visualize probe occupancy grids using VMD. Simply load .dx
files and create isovolume representations. An example
is shown below for sample_IPRO.dx, and other grid files.
Mesh surfaces correspond to locations that were highly enriched with probes. Coloring
is as follows:
- isopropanol: green (high enrichment at the binding site)
- acetate: red (enrichment at the surface, not that proetein has +5 net charge)
- isopropylamine: blue (few interaction spots)
- acetamide: magenta (not observed to interact with this protein much)
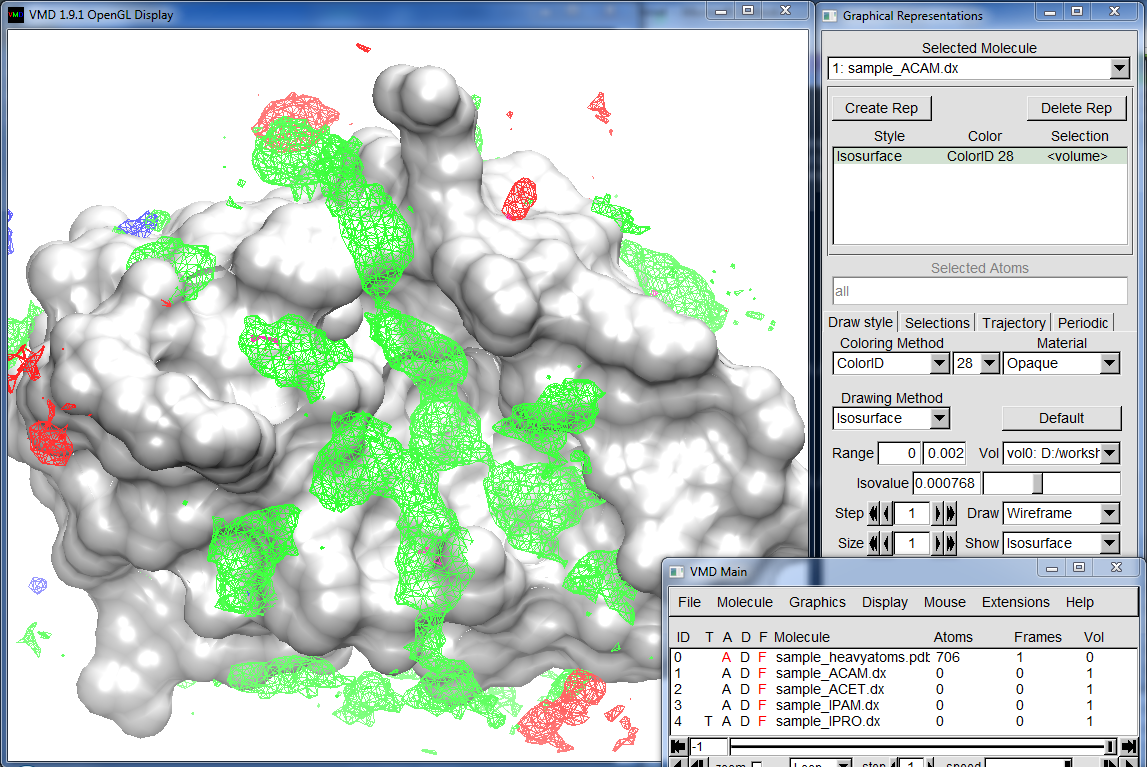
Note that values in occupancy grids is the count of central carbon atoms of probe molecules. Since the grid elements (voxels) are small (0.5A dimension), the occupancy numbers are small. You will need to adjust Isovalue value in VMD Representations window to make grid elements visible.
Similar representations can be generated for water or other atom type specific grids too.