Principal Component Analysis
We will use ProDy Interface of NMWiz plugin to perform a comparative analysis of ubiquitin dynamics predicted using theory using anisotropic network model (ANM) and inferred from experimental structures using principal component analysis (PCA).
Let’s fetch a PDB files that contains a solution (NMR) structure using prody fetch command:
$ prody fetch 2k39
Alternatively, you may use a browser to download these files. 2k39 file can be loaded into VMD at startup as follows:
$ vmd 2k39.pdb
This file contains 116 solution structure models of the protein Ubiquitin, so it will be suitable for comparison of theoretical predictions with experimental observations.
NMWiz - Main window can be accessed via the menu of VMD Main window. Click on ProDy Interface and a window listing molecules and ProDy jobs will pop up.
Atom Selection
In both ANM and PCA calculations, we will omit the flexible C-terminal tail of ubiquitin, since incorporating this flexible tail skews the calculations and results highlight local tail motions instead of collective global motions that we are interested in.
We enter the selection string resid <= 70 and protein and name CA and
click Select. 70 Cα atoms will be selected for calculations.
PCA Calculation
Now, we will use all ubiquitin models for the PCA calculation. Select PCA Calculation in the ProDy Job Settings panel. Keeping PCA (EDA) Settings unchanged, click Submit Job. Results will be loaded automatically when prody pca command finishes the calculations.
ANM Calculation
First, we perform ANM calculations, which is the job type selected by default. We will use 78th NMR model for ANM calculations, because this model is the closest to the average of the ubiquitin NMR ensemble. Since VMD frame (model) numbers start from 0, we will change the Frame number to read 77.
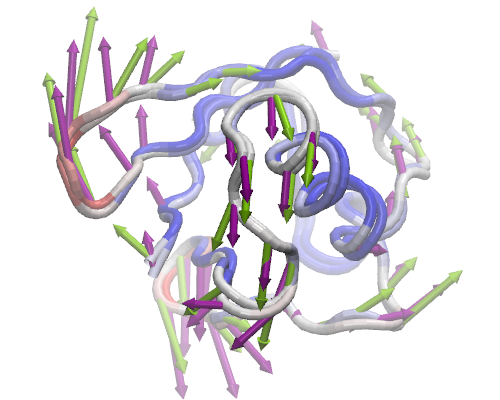
PC 2 (purple) vs. ANM mode 2 (lime green)
We keep the rest of the parameters unchanged, and click Submit Job. This action will run prody anm command in the background and load the results when calculations are finished.
Comparison
For each dataset you load into or generate via NMWiz, a GUI will pop up with independent controls for normal mode display, animation, and plotting. Select PC 2 and ANM mode 2 and try to get the view in the image in VMD display.
Clicking on Options buttons will expand the GUI showing more controls for fine tuning the display. Exploring these options is left to you. You can adjust the quality of the arrows and protein to get a publication quality image. In addition, you can make mobility plots and generate animations for the selected mode.