Using NMWiz
This chapter provides an introduction to NMWiz and its capabilities.
Main Window
NMWiz is located in menu and labeled as Normal Mode Wizard, as shown below:
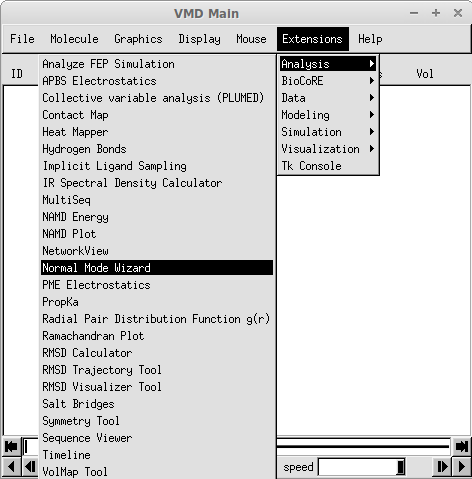
Location of NMWiz plugin in VMD menus.
When you first open NMWiz, you will see the NMWiz 1.2 - Main window shown below:
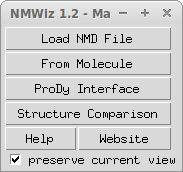
NMWiz Main window.
NMWiz 1.2 - Main window offers options to load precalculated data or to generate data for molecules loaded in VMD:
- Load NMD File lets you load precalculated data (
.nmdfiles) for analysis.- From Molecule lets you load precalculated data stored in molecular data formats recognized by VMD.
- ProDy interface facilitates ANM, GNM, and PCA/EDA calculations from VMD. This functionality is illustrated in the following chapters.
- Structure Comparison facilitates calculating, visualizing, and animating deformations between two frames of the same molecule or between two separate structures.
NMD Format
NMD files (extension .nmd) are plain text files that contain at least
normal mode and coordinate data. In addition to PCA, EDA, NMA, ANM, or GNM
data, arbitrary vectors can be stored in NMD files. The following data fields
are recognized:
- coordinates: Coordinates must be provided in one line as a list of decimal numbers. The number of atoms in the system is deduced from size of this data line.
- mode: Normal mode array. Each normal mode array must be provided in one line as a list of decimal numbers. Mode array may be preceded by mode index and mode length (square root of variance or inverse frequency).
- title: A title for the dataset.
- names: Atom names. Default is “CA” for all atoms.
- resnames: Residue names. Default value is “GLY”.
- chainids: Chain identifiers. Default value is “A”.
- resids: Residue numbers. If this data line if not found, residue numbers are assigned starting from 1 and incremented by one for each atom.
- betas: Beta factors. Default value is 0 (zero). B-factors are used to color the protein representation.
Note
All data types must be listed in a single line. The size of data lines must match the number of atoms in the system, i.e. the size of coordinates line.
For example, 1dlo_anm.nmd contains following lines:
nmwiz_load 1dlo_anm.nmd
name 1dlo
atomnames CA CA CA CA CA CA CA CA CA CA ...
resnames PRO ILE SER PRO ILE GLU THR VAL PRO VAL ...
resids 1 2 3 4 5 6 7 8 9 10 ...
chainids A A A A A A A A A A ...
bfactors 71.47 63.68 46.35 42.28 36.52 31.66 20.85 18.49 24.94 29.01 ...
coordinates 172.541 -33.818 72.141 172.591 -29.981 71.748 171.498 -29.271 ...
mode 1 5.08 0.010 -0.014 -0.030 0.011 -0.013 -0.029 0.006 -0.012 -0.027 ...
mode 2 3.99 -0.003 -0.014 0.007 0.001 -0.016 0.002 0.001 -0.019 0.000 ...
mode 3 2.82 0.010 0.027 0.000 0.006 0.028 0.003 0.005 0.028 0.004 0.002 ...
...
The first line in this file contains nmwiz_load 1dlo_anm.nmd command.
With this, you can make vmd load this file first thing when it
starts:
$ vmd -e 1dlo_anm.nmd
Note
Any data field name that is not recognized by NMWiz, such as
nmwiz_load 1dlo_anm.nmd will be omitted.
NMWiz Window
Now, let’s load 1dlo_anm.nmd file to introduced the NMWiz
window:
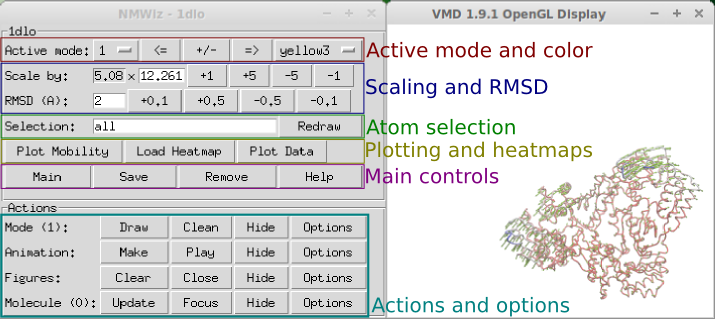
NMWiz GUI
Changing and Editing Modes
The active mode is represented by arrows starting at the atom locations and pointing in the direction of motion. The top pane of the NMWiz window contains tools for changing some of the basic features of the displayed mode.
Active mode and color
The active mode can be changed using the drop down menu or incremented using the <= and => buttons. Changing the active mode will hide previously generated depictions, and the newly depicted mode will be assigned a distinct color.
Mode scale and direction
Mathematically, each mode’s sign is arbitrary. NMWiz depicts normal modes as they are read from the input file, but the +/- button changes the mode’s sign, inverting its direction. The size of the arrows can be adjusted using the Scale by or RMSD controls. * Scale by: The first number is the inverse of the mode frequency, and the second is a real-valued scaling factor that may be incremented or decremented using the adjacent buttons. The +/- button controls the sign of the scale factor. By default, NMWiz scales all modes to 2 Angstroms RMSD. * RMSD: Arrow length can be adjusted to show a specified displacement along the active mode. The sum of squares of the arrow lengths will be the square of the specified RMSD.
Atom selections
Arrows are drawn for selected atoms. You can enter any valid atom selection string to display arrows for a specific part of the molecule.
Mode options
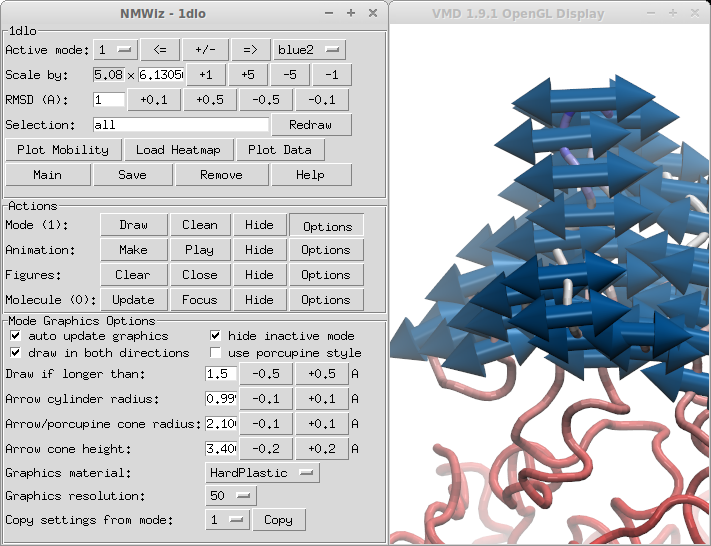
Mode Graphics Options panel
Mode Graphics Options panel allows for customizing the look of arrows. You can change the size, length, material, and resolution of arrows, and also select to use porcupine quills instead of arrows.
Note
Mode representation is not redrawn after manual changes in variables. When this is the case click one of Draw or Redraw buttons.
Representations
You can change molecule representations through NMWiz. The Molecule number in the Actions panel shows the index of the molecule that the changes will affect. If you would like NMWiz not to interfere with your customized visualization of this molecule, you can turn this off in the molecule Options panel. Alternatively, you can Hide this molecule, and make custom representations for a molecule that you load into VMD manually.
Animations
Clicking will start an animation along the active mode. The animated motion changes the structure along the mode in both directions with an amplitude given by the RMSD displayed in top panel.
You can adjust animation settings, such as number of frames, using the panel.
Plots and Heatmaps
You can generate plots and heatmaps that are linked to the protein display. Click Plot Mobility, for example. You will see a plot of the residue mean squared fluctuations for the active mode. Clicking the points on the plot will toggle labels for the corresponding atoms in the VMD molecular display.
Main Controls
Use the following controls for:
- Main - Open the NMWiz main window, useful when it’s closed
- Save - Save current dataset in NMWiz format
- Remove - Remove current dataset and free memory
- Help - Get some help
Efficiency Tips
Displaying large number of primitive graphics for large molecules may make your system unresponsive. You can try some of the following tricks to speed up drawing arrows and manipulating the view.
Show Fewer Arrows
- Mode visualizations for large molecules may become cluttered with arrows. You can show a subset of arrows evenly distributed over the molecular system by making a selection using
%and entering it into the Selection box:
index % 2 == 0- shows every other arrowresid % 4 == 0- shows arrow for every fourth residue- To only draw arrows that are longer than a user-specified threshold length, use the options in Mode Graphics Options, shown in Figure 2.4.
Depending on the molecule one or both of these tricks can provide a more responsive experience and a better (less crowded) depiction of motions.